Skip to content

Author: Jennifer Valentino

The Surveillance Catalog: Made Possible by DocumentCloud

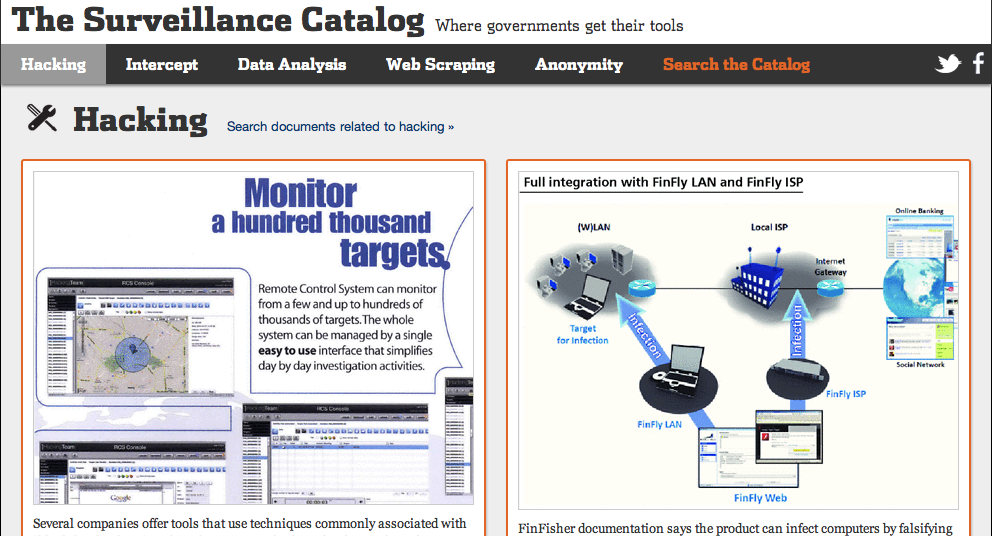
Image from Surveillance Catalog

This fall, The Wall Street Journal obtained a set of documents from a secretive trade show for surveillance and intelligence tech. The marketing materials reveal an industry that has grown rapidly in the past 10 years to supply the increasing demand from governments.

In addition to the usual articles in print and online, we wanted to give readers a chance to see the documents themselves. To do this, my fellow online journalists Zach Seward and Jeremy Singer-Vine suggested a service called DocumentCloud — part of Investigative Reporters and Editors, a nonprofit organization dedicated to investigative journalism. DocumentCloud lets journalists upload documents, annotate and categorize them and then use them in interactive graphics and the like. Documents are automatically run through an “optical character recognition” system, so they’re easily searched. Readers can view the journalists’ notes or download the original document as well.

As a new user of the system, I found DocumentCloud to be slick and incredibly easy to use. We couldn’t have completed our project so quickly without this tool. There are, however, a few things I’d love to see, including the ability to categorize annotations. This sort of finer control would allow readers to see only annotations related to glossary definitions of words, for example, or notes that correspond to certain stories. The folks at DocumentCloud are regularly updating the features. If you’re a journalist who regularly uses original source material, you should check it out.
A Week on Foursquare

Note: Several years after I published this post, the Journal’s graphics server was hacked, and the graphic itself was lost.

The graphic above is part of a project Albert Sun, Zach Seward and I did for The Wall Street Journal that looks at a week’s worth of data from Foursquare — which is a mobile app that lets people “check in” to different locations. This was one of those projects that was done in our “spare time” — of which we have very little — so it took us a few months. Foursquare is still kind of a niche technology, used by only a small percentage of people, but it’s fascinating to see just what information you can get even from people who are willing to freely give up their data.

We looked specifically at New York and San Francisco, two cities with many early Foursquare users. Much of the data showed us what we already knew, for example that people in New York have weekday lunch in Midtown and go out in the Lower East Side on Friday nights. But there were some interesting tidbits as well. Among my favorites: The most disproportionately male locations were gay bars and … tech start-ups. And San Franciscans love coffee shops, while New Yorkers love bars. For more, see our graphic and blog post.

What Is ‘Big Data’?

I spent three glorious days at the Strata conference on “big data” earlier this month — in sunny Santa Clara, surrounded by statistics nerds. The confab, put on by the folks at O’Reilly, proved to be fertile ground for potential stories, as well as for new ways to convey them based on data.

But one question still nags me about this field: What is “big data” in the first place? After all, large data sets have been around for years — although it’s true that we’re now talking petabytes instead of lowly terabytes. Something else that isn’t so new: “data mining,” or the parsing of said data to find patterns, often using artificial intelligence. Furthermore, it’s not always the size of the data that matters; the visualization techniques being discussed at Strata, for example, could very well be used with smaller data sets.

What’s new isn’t just the size of the data involved, or even the fact that it’s being analyzed, but how important and accessible it now is. The point is that data are now everywhere, being scattered like so many breadcrumbs. Tyler Bell at O’Reilly Radar has a good post on the many metaphors being used to describe the concept — like “the new oil,” “data deluge” and my personal favorite, “data exhaust.”

Several folks at the conference posed “data science” as an alternative term to “big data,” and I think that works. It certainly broadens the subject and seems more understandable.

The iPad in Therapy

One of my relatives, a speech therapist, mentioned to me recently how enthusiastic her students were about the iPad. It turns out she’s not alone.

In a Wall Street Journal article in October, I wrote about how the rise of mainstream tablet computers is having unforeseen benefits for children with speech and communication problems — and how it has the potential to disrupt a business where specialized devices can cost thousands of dollars.

The story involves a subject that I find fascinating — the way kids use technology. They seem to take to new gadgets more quickly than adults and are less afraid to experiment. But during the course of researching this article, I also found that there are seemingly simple things they have particular trouble understanding — like volume controls, or the proper use of the “home” button on the iPhone.

If you’re looking for more information on software and devices for speech therapy, I’m afraid I’m not an expert. (I’ve been getting a lot of requests along these lines.) But a good place to start is the American Speech Language Hearing Association.

What They Know

Note: Several years after publication of this post, the Journal’s graphics server was hacked. Portions of the online graphics related to this series may not be available.

For the past few months, my editor, Julia Angwin, has been leading a team looking into the use of information gleaned online and through other technology to compile dossiers of people and their preferences. The screen shot above provides a visualization of the primary database in this project — a look at the “trackers” on the 50 top websites, and the companies to which they send data about visitors’ browsing habits.

The full graphic, available here, gives a good snapshot of what’s going on in the burgeoning field of behavioral advertising, a complex and rapidly expanding field that is coming to rely on “big data.” And it raises plenty of questions for consumers; it’s not always clear what is done with the data or how long it is kept. Much of the data collected on browsing habits does not contain what’s known as “personally identifiable information,” such as name and Social Security number. But as dossiers become more comprehensive, researchers say such precautions don’t mean the profiles are actually anonymous.

As part of this series, which the Journal is calling “What They Know,” I wrote up some instructions for maintaining privacy online. And we’re working on some other exciting things. So stay tuned.

Episode IV: A New Job

For most of my time at The Wall Street Journal, I’ve been a “Web producer,” laying out stories on the website’s home page, editing headlines and descriptions, that sort of thing. Recently I moved into a new role with the Journal’s Digits technology blog.

You can check out my work there. The blog looks at start-ups as well as major technology companies, but I’ve found that some of my favorite pieces involve tech research and technology policy. Recently I’ve looked at things like government use of technology in Manor, Texas, and whether doctors should Google their patients. If you work with these kinds of topics and have a tip for me, feel free to drop me a line at jennifer[dot]valentino[at]wsj[dot]com.

News on Haiti: Popular, Also Unpopular

The tragedy of the earthquake in Haiti has obviously captivated people’s attention over the past few days. People are donating, tweeting and searching for news about the quake. So why do the most popular stories on many of the top news Web sites have nothing to do with Haiti?

The Haitian national palace. Photo by the U.N

The top items at WSJ.com right now include an interview with Glenn Beck and article about pay at banks. And it’s not just that Journal readers’ politics make them more likely to be interested in those topics; the New York Times isn’t currently listing any Haiti stories among its most read either. On the BBC, stories about Haiti are trumped by a video of a dog that understands Polish.

The Times post linked above suggests that people can’t cope with the scale of the problem, and so they watch pet videos instead. I think that might be true — except for the fact that people actually are coping with the problem as much as can be expected. They’re donating in record amounts through text messaging and the like; it might not be much, but it certainly could be less. Most people realize they can’t physically go to Haiti and save people, but they aren’t being completely inactive, either.

So what’s the answer? I don’t know. I’d guess, though, that people are just successfully compartmentalizing the news and quickly making decisions about what actions (like donating) actually help them cope and what actions probably wouldn’t do much at this point except make them sad.